

Tegin Racette & Braison Desjarlais
Age 11 | O-Chi-Chak-Ko-Sipi First Nation, Crane River, Manitoba
Manitoba First Nations Science Fair 2018 Gold Medal | Manitoba Schools Science Symposium 2018 Silver Medal
In our Native Language Class, our teacher often tells us stories about our people’s connections to the land. We were taught about the First Nations’ special relationship with the earth and all living things in it. Our relationship with the land is not ownership but one of stewardship or management.
One of the most debated environmental issues that affects land and water is oil pipelines due to its danger of producing oil spills. An oil spill is a form of pollution deemed one of the worst environmental disasters. Our project demonstrates a simulation of an oil spill and its effect on our sacred lands, especially on plant growth.
BACKGROUND
When we were in Grade 4, Brandi and Sharnell went into our classroom and presented their project, “Nipi Pimatisiwin” where they introduced Standing Rock. They talked about digging holes in the ground and inserting metal pipes so oil or gas can travel quickly from one place to another.
The question “What will happen when the pipes break?” caught our class’ attention. Brandi and Sharnell then educated us about oil spill possibilities. Their project was quite interesting, so we decided to conduct a simple experiment to find out the effects an oil spill has on plant growth.
PURPOSE
The purpose of the project is to:
• Show a simulation of an oil spill and its effect on plant growth
• Compare growth of plants treated with water, water and oil, and water and gas.
HYPOTHESES
Our project has the following hypotheses:
H01: There will be no significant difference on the rate of growth of tomato plants treated with water compared to water and oil solution. (H01: μ1 = μ2)
H02: There will be no significant difference on the rate of growth of tomato plants treated with water compared to water and gas solution. (H02: μ1 = μ3)
MATERIALS
• 1- 5 gallon aquarium • Grow Light
• Oil • Seed starting trays
• Facial masks • Latex gloves
• Gas •Liquid droppers
•Plastic rulers • Water
• Measurement log form • Hand trowels
• Tomato Seeds • Project log book
• Pens • Goggles
• Disposable lab gowns
PROCEDURE
Seed Preparation: We wrapped the tomato seeds in a kitchen towel and moistened it with water. We left it overnight before transferring the seeds into the seed starting tray. We then put the seeds under a Grow Light to facilitate the germination process.
Seed Starting Tray Preparations: We labeled the top part of our seed trays with letters (A to C) that corresponds to the different types of liquids that will be used to water each tomato seed. On the left side of the seed tray, we put numbers (1 to 6) to determine how much of the samples per liquid type we are producing. We filled the seed tray with soil. We poked holes on the catch basin of the seed starting tray so that liquid is able to properly drain and the seeds do not absorb a different liquid dilution.
Liquid Preparations: We mixed 100 mL of oil and 900 mL of water. We also mixed 100 mL of gas and 900 mL of water. Lastly, we prepared 1000 mL distilled water. These liquids will be used separately to water the plants.
Watering and Measuring: Our experiment ran for 12 days: from February 19 to March 2. February 19, 2018 marked Day 1. It was when we started measuring the height of our tomato plants watered with different liquid solutions. The tomato plants were watered every other day with 10 mL of its respective liquid solution.
Data Analysis: with the help of our mentors we analyzed the data we gathered in order to determine if we are accepting or rejecting our hypotheses.
RESULTS
We utilized two statistical equations to test our hypotheses. We used Analysis of Variance (ANOVA), which is a test to compare two or more means to find out if we will accept or reject our null hypotheses. Then, we subjected the means of plant growth on a t-test.

Table 1. Average growth of tomato plants treated with water and water & oil.
Before having treated the data statistically, we could tell that oil and gas had really bad effects on plants simply by looking at the average plant growth. Doing the ANOVA test confirmed our observations. However, just to make sure, we still performed a t-test.
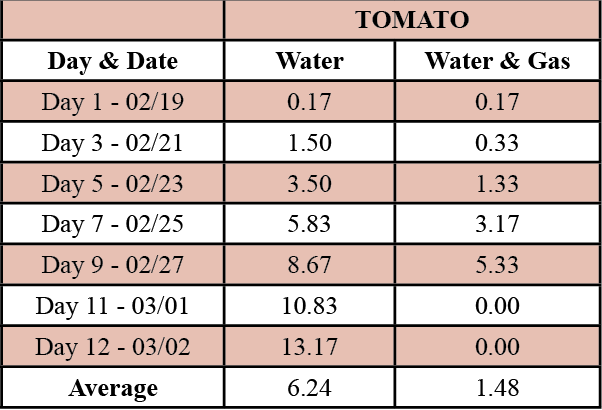
Table 2. Average growth of tomato plants treated with water and water & gas.

Table 3. Summary of t-test results.
OBSERVATIONS
We saw the reaction of the tomato plants fed with oil and gas through their leaves. Their leaves started to lose “strength” and eventually the tomato plants died.
CONCLUSIONS
The results generated were able to prove that oil and gas have really harmful effects on the land. We are therefore able to hypothesize that it is also harmful to all the creatures that depend on it
APPLICATION
This project still considers the welfare of First Nations people who are very much dependent on the land. As growing students, we believe we have the ability to be Sacred Land Protectors. This project helps us promote environmental awareness among our fellow youth.
FUTURE STUDIES
Our simple experiment can be replicated anytime. We suggest the following:
• More time for observations must be allotted so that the rate of plant growth can be compared and analyzed more extensively. We only had 12 days for this experiment and extending the time frame to a few months will probably provide more remarkable results.
• Include a larger population size for the experiment.
• Use different varieties of plants. We can even use our local plants here like the willows, or spruce trees.
MIIGWETCH
The success of our science project has been attained through collaboration. We would like to extend our gratitude to the following: O-Chi-Chak-Ko-Sipi Chief and Council, Donald Ahmo School Administrators and Staff, the School Science Fair Committee, our supportive parents and guardians, and above all to the Great Creator who makes all things with a purpose.
REFERENCES & BIBLIOGRAPHY
Assembly of First Nations. Honouring Earth. Retrieved February 12, 2018 from
http://www.afn.ca/honoring-earth/
Eastman, B. & Desjarlais, S. (2017). Nipi Pimatisiwin. Manitoba First Nations Science Fair.
McMillan, J.H. (2012). Educational research: Fundamentals for the consumer. Boston: Pearson Education Inc.
Oil Spill Information for Kids. Retrieved February 12, 2017 fromhttps://sciencing.com/oil-spill-information-kids-5444185.html
National Geographic. Oil Spills. Retrieved February 14, 2018 from https://www.nationalgeographic.org/education/oil-spills/
SFGATE. How an Oil Spill Affects Photosynthesis. Retrieved February 12, 2018 from http://homeguides.sfgate.com/oil-spill-affects-photosynthesis-79801.html
TEGIN RACETTE & BRAISON DESJARLAIS
(As written by Kevin Germino, science teacher at Donald Ahmo School)

Tegin is an old person in young boy’s body. He will never run out of topics to talk about. He loves reading a lot and he always shares his knowledge. Admittedly, he loves to eat. He always says that he wish he was a Filipino, so he could eat rice every day! He loves his family so much! He enjoys outdoor activities. He really knows how to show gratitude to his mentors.
Braison is the younger brother of Skylin, and just like his brother, he can be considered a “veteran” science fair kid! Bee, as he is fondly called by everyone in school is a very responsible (and I mean it!) child! He knows that there is a right time for everything, whether be it studying, playing, or fooling around. He is also very meticulous (in a good way)! When he has spare time, he likes playing outside with friends! He loves his family so much!