

Jasmine Rahman
Age 14 | St. John’s, Newfoundland and Labrador
CWSF Excellence Award: Intermediate Silver Medallist
Growing plants in Newfoundland is a difficult task due to a short growing season, suboptimal temperatures and poor quality of the native soil (Ricketts, 1987). Newfoundland soil is known to be quite acidic and excessively stoney so there is very quick drainage of water and nutrients (Herigna, 1981). Any potential fertilizer attempting to enrich the native Newfoundland soil will have to address these challenges. In this project, various combinations of organic waste will be used to enhance the native Newfoundland soil.
BACKGROUND
Biochar is a stable, carbon rich, fine grain residue that can prevail in soil for decades. It is a combination of “biomass” and “char” which is burned in the absence of oxygen (Biochar Overview, n.d.). The physical and chemical properties of biochar are highly dependent on the feedstock type, pyrolysis temperature and process parameters. The waste materials that constituted the biochar in this experiment included fresh and aged sawdust, and feedstock waste (including sewage sludge and chicken manure). The primary conditions for the fast pyrolysis were heating at 450 degree Celsius at a rate of 2-4 kg of biomass per hour. Biochar can improve plant growth as it can increase pH and act as a scaffold to hold moisture and prevent nutrient runoff (Ding, 2016). Recent studies have also suggested that biochar may alter the soil microbial diversity (Domene, 2015; Prayogo, 2016). Fish hydrolysate is ground up fish waste transformed into a liquid (Hordour, 2010). The fish hydrolysate used in this experiment contained guts, bones, scales and remaining meat of the fish from commercial fishermen. These fish byproducts underwent cold processing after the fish wastes were treated with enzymes to break down organic substances into small organic molecules. The benefits of the fish hydrolysate include its potential to be used as fertilizer, animal food and nutraceuticals for humans.
HYPOTHESIS
The addition of biochar and fish hydrolysate to the native soil will synergistically enhance plant growth as compared to either biochar or fish hydrolysate alone and this improvement is associated with increased soil microbial diversity.
MATERIALS AND PROCEDURE
Radish seeds were planted in 33 identical pots that consisted of different quantities of either biochar (BC), fish hydrolysate (FH) or the combination of BC+FH (Figure 1). These organic wastes were mixed with native Newfoundland soil. The independent variables included various percentages of BC, FH, or combinations of BC+FH. In total 33 pots were allocated into 11 groups.

Figure 1. Schematic of 33 pots divided into 10 groups used in the experiment.
Newfoundland soil represented the control group (six pots). Four groups only had BC added to native soil. The percentage by weight of BC added to the native soil was varied in each group to establish BC 1%, BC 5%, BC 10%, BC 25% (each group had 3 pots). One group had one gram of FH added to the soil (three pots). Four groups had various percentages of BC and one gram of FH added to soil; three each pots each for BC 1 %+ FH; BC 5 %+ FH; BC 10%+ FH and BC 25% +FH. FH was not varied as a previous experiment had shown that a small increase in concentration was harmful for plant growth, possibly due to the high concentration of nitrates in the FH. On Day 60, the plants were removed and the surface area of the leaves was measured using 1 cm-squared graph paper. The total surface area of the radish leaves in each pot was the primary dependent variable. The number of square centimeters covered by each leaf was recorded and partially covered squares were counted only if at least 50% of the grid was covered. Two readers were used and online practice sessions were conducted to establish consistency and accuracy (Lab bench activity, n.d.). The amount of light exposure, water, temperature and growing time were identical for all plants. To assess differences in plant growth descriptive statistics, Levene’s test for inequality of variances, along with student t-tests and ANOVA to compare group means were performed. All p-values reported were two sided.
Nine soil samples were sent for microbial profiling by interrogating the 16S ribosomal RNA (rRNA). The 16S ribosomal RNA sequencing is a common method for identifying presence of bacterial families as hypervariable regions contain species specific sequence that can identify different bacteria (Ju, 2011). The selected samples were from the groups BC 5% alone, FH alone, and BC 5% + FH. The BC 5% group was selected as visually BC 5% + FH demonstrated the best plant growth. Microbiome Insights at University of British Columbia sequenced 16S (V4 region) of the microbes on Illumina MiSeq (Ju, 2001). The high quality reads were classified using Greengenes.
RESULTS
When just BC was added to the native soil, at least 10% of BC by weight was needed to show a numerical increase compared to controls. BC 10% demonstrated a statistical trend for increased mean growth, with a surface area of 11.7 cm2 (4.6sd) vs. 6.8 cm2 (2.9sd) (p=0.09) for the control (Figure 2).

Figure 2. Mean surface area of leaves with differing percentage of biochar (BC) versus controls.
BC 25% had a mean growth of 39.5 cm2 (31.8sd) vs. 6.8 cm2 (2.9sd) in controls, but this was not statistically significant likely due to the large variance in BC 25% group. Adding FH to the native soil resulted in almost a three fold greater surface area as compared to the native soil [(20.1 cm2 (7.2 sd) FH vs 6.8 cm2 (2.9 sd) controls]. This increase in the FH group did not reach a statistical significance at the p<0.05 cutoff but there was a statistical trend as the p value was 0.07 (Figure 3).

Figure 3. Mean surface of leaves with Fish Hydrosylate (FH) versus Control (Native Soil).
As seen in Figure 4, the use of combination waste (BC + FH) resulted in greater mean surface area compared to BC or FH alone for BC 1%, 5% and 10. The BC 1%+FH was statistically significant when compared to FH alone (p=0.05) and BC alone (p=0.04). For the BC 5%+FH, this exhibited the greatest numerical difference but only showed a statistical trend versus FH (p=0.09) and BC (p=0.10), due to variability of plant growth in this group. Similar findings were noted in the 10% group, with BC + FH demonstrating numerical superiority for the combination but only a statistical trend when compared to FH (0.1) but not versus BC alone (p=0.14). Interestingly, the combination of BC 25%+FH was detrimental for plant growth. Among the three pots with this combination, two pots failed to sprout a plant. The emergence of the third plant was greatly delayed as compared to other pots.
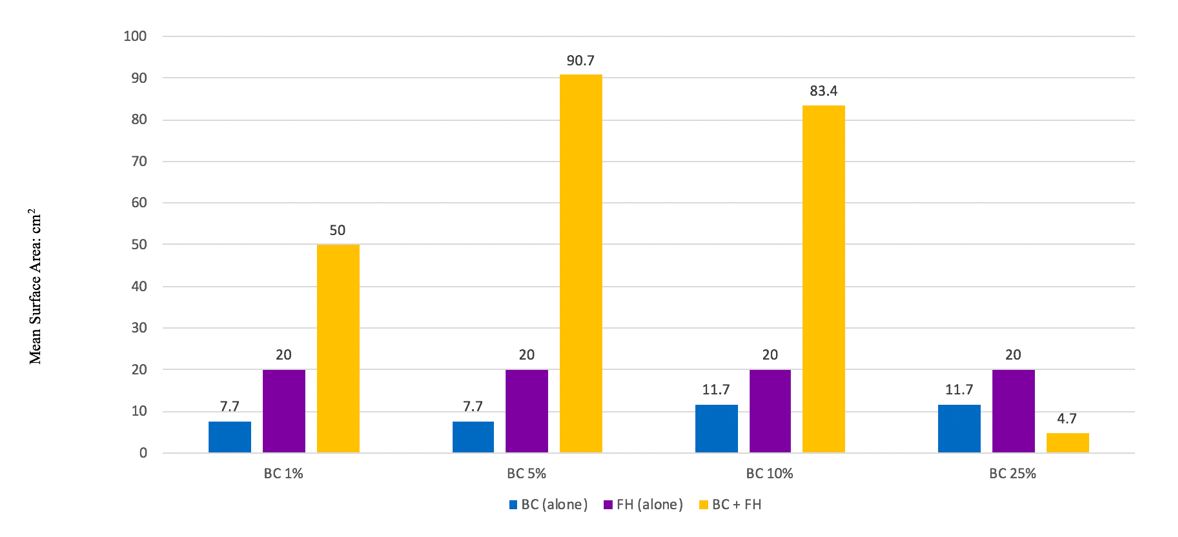
Figure 4. Plant growth for BC alone vs combination waste (BC+FH); FH alone vs combination was (BC+FH).
As the combination of BC (1% to 10%) + FH appeared to enhance plant growth, the groups involving BC1%, BC5% and BC10% + FH were pooled for a secondary analysis and compared to a pooled sample of BC 1%, BC 5, BC 10% alone and FH alone. In this subset analysis, ANOVA testing noted that there was a between group difference (p=0.001) and there is a marked increase in growth that was statistically superior in the combination (BC+FH) versus BC alone (p=0.002) and FH alone (p-0.006) (Figure 5).

Figure 5. Pooled plant growth of BC (1-10%) + FH as compared to BC (1-10%) alone and FH alone.
The microbial analysis also provided interesting findings (Figure 6). Data generated from sequencing the 16S (V4 region) was filtered and 4.9 X 10⁵ high quality bacterial reads were classified using Greengenes (McDonald, 2011). Greengenes is a database with detailed taxonomy of microbes that use a full-length 16s rRNA gene.

Figure 6. Community microbial composition: Top genera by overal relative abundance.
The relative abundances of the most abundant genera, families and phyla were plotted on the top panel. Samples 7, 8 and 9 with BC 5%+FH exhibited relative abundance of four genera (Mycoplana, Pseudomonas, Pedobacter and Flavobacterium) compared to FH alone or BC5% alone (Figure 5). Species from these four genera represent gram negative bacteria and have been previously identified as plant promoting rhizobacteria (Panke-Buisse, 2015).
DISCUSSION
Biochar alone appears to improve plant growth; however, at least 10% biochar needs to be combined with the native soil to show a trend. The addition of fish hyrolysate alone appears to improve plant growth, and the magnitude of effect was about two fold greater than the native Newfoundland soil. The combination of organic wastes (BC+FH) appeared to be synergistic. For instance, when BC 1% and BC 5% were used alone there was only a marginal increase in plant growth as compared to native soil. When the biochar at these concentrations was combined with 1 gram of FH, the increase in plant growth was 7-10 fold higher than BC alone and 2-4 times higher than FH alone. This demonstrates that there must be a synergistic effect on plant growth when biochar and fish hydrolysate are combined. The enhancement of soil microbial diversity within the combination groups was likely an important factor in enhancing plant growth. A potential explanation for this observation is that the biochar provides a lattice where water, nutrients and microbes can bind and enhance the surface contact for the soil. The addition of fish hydrolysate enriches the soil with the biochar by providing a source of substrates that the plants can break down to extract essential nutrients. Interestingly it appears that BC 25% + FH is harmful to the radish seeds and plants. Thus the optimal combination of these two organic wastes resulted in the best plant growth.
The microbial sequencing component noted increased abundance of Pseudomonas and Flavobacterium in the study, which supports the working hypothesis which stated that the combination of biochar and fish hydrolysate to the native soil will synergistically enhance plant growth. Strains from these genera are well-established plant promoting rhizobacteria; they can directly affect plant growth through phytohormones that can decompose simple sugars and carbon compounds and indirectly by decreasing harmful pathogenic organism (Panke-Buisse, 2015).
Study limitations include a small sample size in each group, high variability of the surface area within groups, and a semi-quantitative method to measure surface area of the radish leaves. The combination of BC+FH needs to be compared to commercial fertilizers and its safety needs to be evaluated.
CONCLUSION
In summary, this study determined that the most efficient use of resources and the best results for plant growth occur when organic wastes (biochar and fish hydrolysate) are strategically combined. The right combination of biochar and fish hydrolysate can greatly improve the agricultural productivity in the native Newfoundland soil. A potential proposed mechanism for the superiority of this combination is the abundance of plant promoting rhizobacteria in the soil. This occurs in the setting of the optimal combination of biochar and fish hydrolysate.
REFERENCES
Biochar overview (n.d.) https://biochar.info/biochar.biochar-overview.cfml
Ding Y, Liu Y, Liu S et al. (2016). Biochar to improve soil fertility. A review. Agronomy for Sustainable Development, 36: 36
Domene X, Hanley K, Enders A, Lehmann J (2015) Short-term mesofauna responses to soil additions of corn stover biochar and the role of microbial biomass. Appl Soil Ecol 89:10–17.
Heringa P.K. (1981). Soils of the Avalon Peninsula, Newfoundland. Newfoundland Soil Survey. Report No. 3. St. John’s, NL: Minister of Supply and Services Canada.
Hordur G. Kristinsson & Barbara A. Rasco. (200) Fish Protein Hydrolysates: Production, Biochemical, and Functional Properties. Critical Reviews in Food Science and Nutrition, 40, 43-81
Ju F, Zhang T. (2001). 16S rRNA gene high-throughput sequencing data mining of microbial diversity and interactions. Appl Microbiol Biotechnol. 99(10): 4119-29.
Lab Bench Activity. http://www.phschool.com/science/biology_place/labbench
/lab9/calcsurf.html
McDonald, D., Price, M. N., Goodrich, J. et al. (2011) An improved Greengenes taxonomy with explicit ranks for ecological and evolutionary analyses of bacteria and archaea. The ISME J. 6(3), 610-8.
Panke-Buisse K, Poole AC, Goodrich JK, Ley RE, Kao-Kniffin J. (2015) Selection on soil microbiomes reveals reproducible impacts on plant function. ISME J. 17; 9(4): 980-9.
Prayogo C, Jones JE, Baeyens J, Bending GD (2014) Impact of biochar on mineralisation of C and N from soil and willow litter and its relationship with microbial community biomass and structure. Biol Fertil Soils 50:695–702.
Ricketts, R. (1987) Soils of the Markland Area. Newfoundland Report 20 Newfoundland Soil Survey. St. John’s, NL: Government of Newfoundland and Labrador.
Rodriguez H, Fraga R. (1999) Phosphate solubilizing bacteria and their role in plant growth production. Biotechnology Advances 17; 319-339.
JASMINE RAHMAN

I am a 14 year old grade 10 student from St. John’s, Newfoundland. I have been participating in science fairs since grade five and enjoy exploring new ideas and presenting my findings. I also enjoy playing tennis, actively participating in various school musical bands and in cooking.