

Sophie Hoye Pacholek
Age 16 | Calgary, AB
CWSF 2019 Excellence Award: Senior Gold Medal | Western University $4000 Entrance Scholarship | Schulich School of Engineering 2nd Place Prize | Lalani Mathematics Award | Sanofi Biogenius 2019 Regional 3rd Place Prize
Four biomimetic wings were designed, 3D printed, and tested in order to determine superior lift, drag, efficiency, and stall performance. In addition to a control wing, three designs were based on the unique evolutionary adaptations of birds and whales: modifications were incorporated to create an avian airfoil, an avian blended winglet design, and sinusoidal protrusions inspired by cetacean morphology. Results showed that an interpolated avian airfoil design improves lift performance, delays stall, and exhibits the highest efficiency at an optimal angle of attack. A sinusoidal wing with leading edge ‘tubercles’ also delayed stall and displayed more consistent lift performance at both windspeeds. These two beneficial modifications could be combined in future work, with the eventual application to unmanned fixed-wing drones for disaster relief and reconnaissance.
PURPOSE
In recent years small unmanned aerial vehicles (UAVs) have begun to emerge as an indispensable tool in many industries, particularly in disaster relief (Winslow, Otsuka, Govindarajan, & Chopra, 2018). Fixed-wing aircraft generally exhibit an advantage to rotor-based drones in terms of overall fuel efficiency and maximum flight distance, yet come with a unique set of challenges (Di Luca, M., Mintchev, S., Heitz, G., Noca, F., and Floreano, D., 2017). Large fixed-wing UAVs can now fly at speeds of up to 70 meters per second and travel up to 40 kilometers in distance. However, smaller drones without expansive fuel storage or lavish budgets are struggling to become reliable, maneuverable, and efficient. The primary purpose of this research was to create a wing design based on avian and whale characteristics that results in overall performance improvements in lift, drag, and stall angle. This work is specifically devised to improve upon high-lift and high-manoeuvrability flight of drones in disaster and reconnaissance situations. Advantages of UAVs for such applications can include a reduced human exposure to danger, increased cost effectiveness, and greater deployability.
MATERIALS AND METHODS
The design criteria for this study were influenced by challenges of scale and the complex morphology of living systems. The issue of scale was minimised by designing wings that overlapped with the Reynolds numbers of soaring bird wings. The Reynolds number is a dimensionless ratio that standardizes aeronautical testing based on size, windspeed, viscosity, and density. Because it is dependent on airspeed and airfoil length, it is not easily scalable between models. For example, a large subsonic aircraft would have a far higher Reynolds number than a small drone or bird. The wings tested have an approximate Reynolds number of 60,000 at 10 m/s and 90,000 at 15 m/s. The challenge of adapting avian complexity to a human-engineered prototype was managed by choosing two fundamental design elements: airfoil and wing shape.
Four wings were designed for testing: a ‘control’ wing based on a standard NACA 0012 airfoil (UIUC Airfoil Database, 2019), a cambered avian airfoil, an avian airfoil with a blended winglet, and a NACA 0012 airfoil with whale-inspired tubercles (the “bumps” on the leading edge of a whales’ flippers), modeled as sinusoidal protrusions on the leading edge of the wing. The manipulated variables of airfoil, winglets, and tubercles were chosen in order to isolate and evaluate the effect of each biomimetic modification. All wing planforms were designed to have a near-identical, rectangular shape to standardise the characteristic dimensions of each wing at two windspeeds.
Xflr5 (a derivative of the popular simulation program Xfoil) was used to interpolate between an albatross and NACA 0009 airfoil, then to simulate 2D lift and drag characteristics before 3D designs were created. This process assisted with the final decision to use a 60% avian airfoil and 40% symmetrical airfoil for superior simulated lift, efficiency, and stall performance. Autodesk Fusion 360 was used as 3D modelling software to create all wing designs. They were then printed on a Monoprice Select Mini V2 3D printer. Each of the four wings were printed in four pieces (to fit on to the 12cm high print bed) and then pinned, glued, prepped, and sanded.
A subsonic open-return blowing-type tunnel was used to perform the experiments. The wind tunnel operated at a specific frequency (e.g. 40 Hertz for 10 m/s) and the wind speed was measured and calibrated with a static pitot tube. The wings were mounted on top of the force transducer and AOA adjuster, and tests were run at 10 and 15 meters per second (40 and 55 Hertz respectively). Forces and torques were measured using an ATI Gamma force transducer.
Because the transducer and AOA adjuster moved with the wing throughout the experiment, normal force (FN) and axial force (FA) were recorded relative to wing position at each angle of attack (AOA) at a range of -10 to 40 degrees, and at a rate of 50 samples/second. Each trial was run with both the wind tunnel off and on to mitigate possible systematic errors. The force transducer apparatus consisted of an automatically timed motor to change angle of attack, controlled by a software program augmented with Arduino components.
A MatLab program was then used to convert the inherent measurements of normal and axial force to absolute lift and drag used in analysis. When the conversion was completed, normal and axial forces relative to the constantly moving airfoil become lift and drag forces relative to the experimental setup as a whole. Figure 1 depicts the components of lift and drag, and the subsequent calculations that determine the transformation of coordinates in force direction are shown below where N represents normal force, A represents axial force, and NON and NOFF respectively represent wind tunnel on and wind tunnel off measurements. The prefix C in notations CN, CA, CL, and CD all represent coefficients. In order to perform the translation from axial and normal force measurements to local x, y coefficient vectors, each measured value was multiplied by the required x and y component (cos AOA and sin AOA) as well as the constant 2/pv2A.

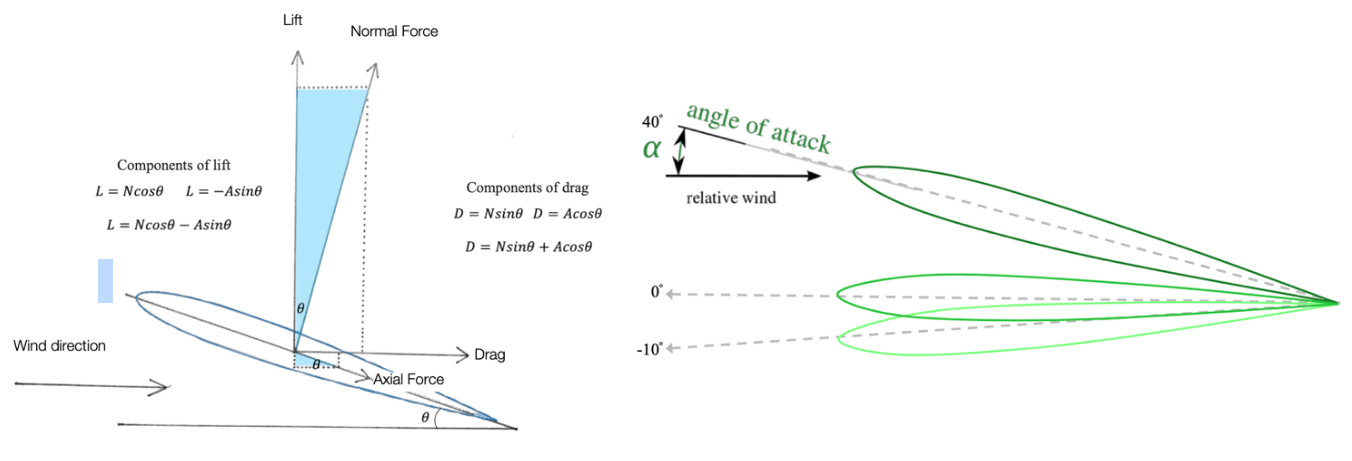
Figure 1. Illustrations of the NACA 0012 airfoil as part of the experimental setup and the range in angles of attack tested.
OBSERVATIONS
Both cambered airfoil designs exhibited superior lift performance compared to the symmetrical airfoils at both Reynolds numbers; lift was up to 5 times higher for the cambered airfoils (Figure 2). The avian airfoils demonstrated positive lift even at negative angles of attack, beginning at -8 degrees. Symmetric airfoils did not exhibit positive lift until -2 degrees. The cambered airfoils exhibited higher lift and gentler stall than either symmetrical airfoil, with no pronounced decrease in lift. The tubercle wing displayed more consistent lift performance at both Reynolds numbers in comparison to an unmodified NACA wing design with an identical airfoil. The NACA 0012 wing stalled slightly earlier than the tubercle airfoil at lower wind speeds, but exhibited similar stall performance to the tubercle wing at 15 m/s.

Figure 2. a) Lift coefficients of four wing designs at a windspeed of 10 m/s, b) lift coefficients of four wing designs at a windspeed of 15 m/s, c) drag coefficients of four wing designs at a windspeed of 10 m/s, and d) drag coefficients of four wing designs at a windspeed of 15 m/s.
The winglet wing exhibited a far greater drag coefficient compared to the symmetrical airfoils and its avian counterpart at angles of attack above 0 degrees (it displayed up to 34% greater drag). In contrast, the drag characteristics of the symmetrical airfoils were nearly identical. The winglet design exhibited the poorest performance of all the wings at 10 m/s, and although its efficiency improved at 15 m/s its maximum efficiency occurred at a negative angle of attack.
As seen in Figure 3, the cambered airfoils also had a maximum lift/drag ratio at lower angles of attack (ranging from -2 to 2 degrees) compared to their symmetrical counterparts (between 2 to 8 degrees). Therefore, the avian airfoil in particular is the most efficient at zero degrees, which may be more ideal for level flight. The symmetrical airfoils were more efficient at an angle of attack of approximately 5 degrees, and while the lift/drag ratio may have been slightly higher than their cambered counterparts, it occurred at less optimal angles for cruising.

Figure 3. Lift/drag ratios of four wing designs tested at a) 10 m/s and b) 15 m/s. The highest ratio represents the highest efficiency.
DISCUSSION
The avian airfoil wing exhibited notably higher lift and delayed stall by over 10 degrees in comparison to the two symmetrical airfoils tested. In addition, it displayed a broad, gentle stall pattern, without abrupt decreases in lift. This pattern was not observed in any other research conducted at low Reynolds numbers (Selig, Guglielmo, Broeren, and Giguere, 1995). This implies that the avian airfoils would be better suited to short runways for takeoff, as they produce higher lift at steeper angles of attack. Gentler stall characteristics could lead to a more robust and adaptable UAV. Because the avian airfoil was most efficient at angles of attack typical of cruising angles (particularly at 15 m/s), this wing is best suited for shorter runways and applications that require superior efficiency characteristics.
The winglet wing exhibited the highest lift of all designs tested. However, its overall efficiency was reduced due to much higher drag, and it reached its maximum lift/drag ratio at negative angles of attack. More work would be required to fully understand the implications of adding a winglet to a wing at low Reynolds numbers.
Adding sinusoidal protrusions (tubercles) to the leading edge of a wing design improved lift performance at the lowest windspeed, delayed stall by approximately 3 degrees, and did not substantially increase drag. While it was outperformed by the avian airfoil, the aerodynamic improvements of tubercles suggest that they could be added to an avian wing design to further enhance lift and stall performance.
It was noted that the drag curves for the two symmetrical airfoils (and not for the cambered airfoils) rose somewhat abruptly at an AOA of around 10 degrees. This phenomenon may simply be due to an increase in drag nearing stall -- or it could be due to laminar separation bubbles. As shown in Figure 4, these pockets of turbulent air occur when the boundary layer partially detaches from the wing. More common at low Reynolds numbers, separation bubbles are typically identified by a characteristic plateau in pressure coefficients or their physical presence is noted with smoke visualization. However, they can also be occasionally identified by noticing a sudden increase, then plateau, in drag curves. The sudden increase in drag is most commonly detrimental to overall aircraft performance.

Figure 4. Diagram adapted from Winslow et al demonstrating the physical effects of separation bubbles at different Reynolds numbers.
There is good agreement between the baseline NACA 0012 airfoil tested for this study (the solid magenta line in Figure 5) and lift and drag coefficients obtained by Winslow et al, 2018. Similar Reynolds numbers were used in both experimental and simulated data from this paper. This comparison validates the measured lift and drag values for the NACA 0012 control wing in this experimental investigation. In the future, the reliability of this data could be further verified by conducting repeat experiments of the same wing design under identical conditions. This would allow for an in-depth error analysis to be performed.

Figure 5. Lift (a) and drag (b) comparisons between data collected in this study and Winslow et al. The solid magenta line represents data collected in this study.
CONCLUSION
This work demonstrated that incorporating avian and cetacean morphological characteristics into fixed wing designs, particularly the addition of an avian airfoil and tubercles, improved overall wing performance. Therefore, biomimicry is a promising field for modifying engineering systems such as Unmanned Aerial Vehicles.
These biomimetic modifications could be applied to “rescue drones” – particularly the incorporation of an avian airfoil because of notable improvements in lift, efficiency, and stall (and therefore maneuverability).
ACKNOWLEDGEMENTS
Thanks to David Wood, Marta Piertzak, and Ayman Mohamed for granting access to wind tunnel resources at the University of Calgary and for providing project feedback.
REFERENCES
M. Di Luca , S. Mintchev , G. Heitz , F. Noca and D. Floreano. (2017). Bioinspired morphing wings for extended flight envelope and roll control of small drones. The Journal of the Royal Society: Interface Focus. 7: 20160092. http://dx.doi.org/10.1098/rsfs.2016.0092
Selig, M., Guglielmo, J., Broeren, A. and Giguere, P. (June 1995). Summary of low-speed airfoil data. Soartech publications. Retrieved from https://m-selig.ae.illinois.edu/uiuc_lsat/Low-Speed-Airfoil-Data-V1.pdf
UIUC Airfoil Data site. (2019). UIUC Airfoil coordinates database. Retrieved from http://m-selig.ae.illinois.edu/ads/coorddatabase.html#B
Winslow, J., Otsuka, H., Govindarajan, B., & Chopra, I. (2018). Basic Understanding of Airfoil Characteristics at Low Reynolds Numbers (104–105). Journal of Aircraft, 55(3), 1050-1061. doi: 10.2514/1.c03441
BIBLIOGRAPHY
Fish, F. E., Weber, P. W., Murray, M. M., & Howle, L. E. (2011). The Tubercles on Humpback Whales Flippers: Application of Bio-Inspired Technology. Integrative and Comparative Biology, 51(1), 203-213. doi: 10.1093/icb/icr016
Hansen, K. L. (2012). Effect of leading edge tubercles on airfoil performance. (PHD thesis). Retrieved from https://digital.library.adelaide.edu.au/dspace/handle/2440/79211
Hossain, A., Rahman, A., Iqbal, A., Ariffin, M., and Mazian, M. (2011). Drag Analysis of an Aircraft Wing Model with and without Bird Feather like Winglet. International Journal of Aerospace and Mechanical Engineering. 5(9). Retrieved from https://waset.org/publications/5593/
Johnston, C. (n.d.). Technical Challenges For Small UAV Payloads. Retrieved from https://www.smithmillermoore.com/Pdfs/technicalarticles/7-11_HT_EM&D_TechChallenges_forSmallUAV_Payloads.pdf
Lee, C., Pang, W., Srigrarom, S., Wang, D., & Hsiao, F. (2006). Classification Of Airfoils By Abnormal Behavior Of Lift Curves At Low Reynolds Number. 24th AIAA Applied Aerodynamics Conference. doi: 10.2514/6.2006-3179
Lee, S., Kim, J., Park, H., Jabłoński, P. G., & Choi, H. (2015). The Function of the Alula in Avian Flight. Nature, 5(1). doi: 10.1038/srep09914
Lentink, D. (2017) Coevolving advances in animal flight and aerial robotics. Journal of the Royal Society: Interface Focus. 7: 20160119. DOI: http://dx.doi.org/10.1098/rsfs.2016.01
McLeod. M. (November 1, 2010). Whale of an Idea: WhalePower’s Humpback-inspired Tubercle Technology marks next evolution in airfoil design. Retrieved from https://www.design-engineering.com/features/whale-of-an-idea/
Miklosovic, D. S., Murray, M. M., Howle, L. E., & Fish, F. E. (2004). Leading-edge tubercles delay stall on humpback whale (Megaptera novaeangliae) flippers. Physics of Fluids,16(5). doi:10.1063/1.1688341
Natural Frequency and Resonance. (2018, September 25). Retrieved from https://community.plm.automation.siemens.com/Natural-Frequency-and-Resonance/p/4984
Siddiqui, N., Asrar, W., & Sulaeman, E. (2017). Literature Review: Biomimetic and Conventional Aircraft Wing Tips. International Journal of Aviation, Aeronautics, and Aerospace. doi: 10.15394/ijaa.2017.1172
Smith, M. J., Komerath, N., Ames, R., Wong, O., & Pearson, J. (2001). Performance Analysis of a Wing With Multiple Winglets. AIAA. doi: 10.21236/ada454384
Sullivan, T., Wang, B., Espinosa, H., and Meyers, M. (September 2017). Extreme lightweight structures: avian feathers and bones. Materials Today, 20(7). doi: https://d oi.org/10.10 16/j.mattod.2017.02.004
Weber, P. W., Howle, L. E., Murray, M. M., & Fish, F. E. (2009). Lift and drag performance of odontocete cetacean flippers. Journal of Experimental Biology, 212(14), 2149-2158. doi:10.1242/jeb.029868
Withers, Philip C. (March 5, 1980). AN AERODYNAMIC ANALYSIS OF BIRD WINGS AS FIXED AEROFOILS. Journal of Experimental Biology. Retrieved from http://jeb.biologists.org/content/jexbio/90/1/143.full.pdf
SOPHIE HOYE PACHOLEK

Sophie Hoye Pacholek is currently a grade 11 student Henry Wise Wood High School in Calgary. From 5th grade onwards, science fairs and independent inquiry projects have been about expanding her learning in a variety of fields. In addition to science, she loves music, art, and burying her nose in a good book. Many of her previous works are inspired by the natural world, often leading to scientific experiments that cross multiple subjects. Science fairs have always been the highlight of the school year, and she has won various awards for her past and present work.