

ANISH RATHOD
he/him | age 15 | Burlington, ON
Proctor Engineering Award, Intermediate | Professional Engineers of Ontario Oakville Chapter Engineering Award, Intermediate | Water Environment Associate of Ontario Award | Bronze Merit Award, Bay Area Science & Engineering Fair
Edited by Arpit Kumar
INTRODUCTION
The ability to predict the future pH levels, total dissolved solids (TDS), turbidity, and soil moisture levels is essential to activities that affect or rely on water pollution and soil hydration. According to the World Health Organization, fifty-five million people are affected by drought annually (WHO, n.d). Furthermore, projections indicate that by 2040, one in four children worldwide will live in extremely high water stress areas (UNICEF, n.d.). The CDC (Centers for Disease Control) states that two billion people lack access to safe drinking water (CDC, 2022). Predicting soil moisture levels in agriculture can assist farmers in making better choices regarding when to irrigate and how much water to use. This can assist in increasing agricultural yields and cut down on water usage, saving farmers money and promoting water resource conservation. Accurate predictions of water quality in the environment are invaluable for identifying potential sources of pollution, such as runoff from agricultural operations or industrial discharge. Regulators and environmental organizations can then take action to address these issues and safeguard water resources.
Accurate water quality forecasting plays a crucial role in identifying areas where water may not be suitable for ingestion by humans or aquatic life. In the context of climate change, soil moisture prediction can help identify areas at risk of drought, which can help manage water resources, predict water shortages and plan. Machine learning models that predict water and soil quality already exist (Zhu, M. et al., 2022); however, a compact device that can both retrieve data and provide real-time predictions of water quality and soil hydration is yet to be made. Benefits of this device over models that run on computers or servers include the ability to track specific, relevant, and local data, reduced price, and the ability to find predicted values of soil hydration, pH, Turbidity, and TDS in local settings and settings with a lack of data about, but not limited to factors like soil dryness and water pollution. Soil hydration will be tracked with a soil hydration meter. It measures capacitance changes caused by changes in the dielectric placed in (Keyestudio, n.d.). Values from the meter are read as a pulse width modulation (PWM) signal and converted to a percentage (Keyestudio, n.d.). The pH meter used on the device works by measuring the voltage of the substance that the device is dipped in, and it is subtracted by the voltage output (Atlas Scientific, 2021). The pH meter comprises a digital meter, a reference pH electrode, and a probe inserted into a substance (Atlas Scientific, 2021). When a pH probe is placed inside a solution, hydrogen ions move toward the glass electrode (Atlas Scientific, 2021). These ions replace the metal ions inside the probe (Atlas Scientific, 2021). A difference in ion activity will result in an alteration in electrical charges (Atlas Scientific, 2021). This will occur if the pH of the substance the meter is placed in differs from potassium chloride, an electrolyte placed inside the probe with a neutral pH. The TDS meter measures water's total dissolved salts, metals, and minerals. The increase in dissolved solids in water can make it more conductive. The TDS meter reads this conductivity in the water and converts the reading to a metric of parts per million (ppm) (“TDS sensor & Arduino interfacing for water quality”, 2022). Turbidity is a metric used to measure the clarity of water (Circuit Schools, n.d.). A turbidity meter sends a beam of light out into the solution it is in (US EPA, 2015). Particles in the solution scatter the light, and a light detector reads the amount of reflected light (Katsoyiannis, I. A., 2005). International health organizations offer guidance on water quality standards. For example, the United States EPA suggests that the pH of drinking water should remain within a range of 6.5 to 9.9. In addition, the government of Canada states that NTU (nephelometric turbidity units) should be at most 1 in drinking water (Government of Canada, 2014). NTU quantifies the clarity of water. The maximum recommended TDS measurement of drinking water is 500 ppm (Fresh Water Systems, n.d.).
The applications of this device are endless. The device can be used in Agriculture. Farmers can use the device to make more informed decisions about where to plant crops when to irrigate them, and how much water to use. The device can reduce the amount of water used to grow crops and limit farmers’ spending on water resources. Furthermore, the device can pinpoint certain potential sources of water pollution, like agricultural runoff or discharge from industrial facilities. This can permit regulators and other environmental parties to take steps to address issues with water pollution and protect water resources. Moreover, the device has climate change adaptation applications. It can be used to identify areas subject to drought. In turn, the device can help with the management of water resources, and it can help plan for water shortages in advance. This apparatus can also track the water produced and cleaned by treatment plants to ensure drinking water is safe for consumption.
MATERIALS & METHODS
In assembling the device, a laptop, Arduino Uno, 30 jumper wires, a Raspberry Pi 4 with 2 GB RAM, a capacitive soil moisture sensor, a potentiometer, a normally-off push button, USB-B cable, desktop keyboard, a computer mouse, Keyestudio TDS sensor, Keyestudio WQ turbidity meter, and a Toshiba 16x2 LCD Panel were obtained. A sample of water and a sample of soil were acquired.
PROCEDURE

Figure 1: Schematic of the device.
A Tensorflow sequential model was used. The dataset that was used was of data points gathered over 32 days. Half the data was used as testing data. Sample data from the dataset is shown in Table 1. Through trial and error, the model was developed to have a 4000-epoch training period, mean absolute error as the cost function and stochastic gradient descent (SGD) as the optimizer. The dataset composed of 4 classes: pH, turbidity, TDS and soil hydration. The data was split into 4 sets of 8: training data, predictions for training data, testing data and predictions for testing data. The device itself was made using modular components. These components were also compact. A 3D-printed case was designed for this device.
The Turbidity, pH, and TDS sensors were placed in a water sample. The soil moisture sensor was placed 5 centimetres deep into the soil sample. The button connected to the Arduino was pressed to get sensor readings. The button was pressed again three times in 24-hour increments. One gram of aluminum sulphate was added to the water sample. The button was pressed 24 more times in 24-hour increments. The predicted readings on the LCD were read and recorded.
RESULTS

Table 1

Table 2
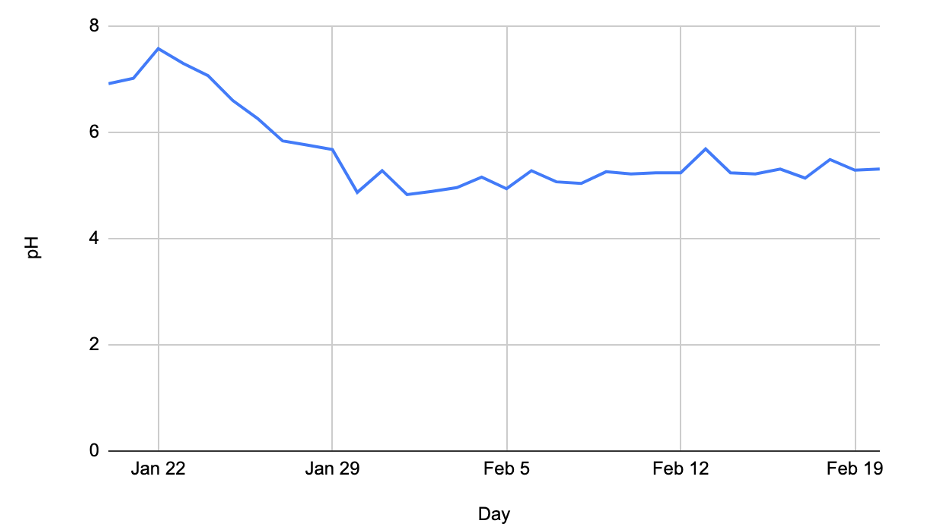
Figure 2: A pH sensor connected to Arduino when placed in a water sample read the pH levels throughout the data-gathering period. This figure shows a downward trend in pH over a month. This is due to the addition of aluminum sulphate to the water sample every four days between January 20 to February 20, 2023.

Figure 3: TDS in ppm throughout the data-gathering period was read by a TDS sensor connected to Arduino when placed in the water sample. Figure 2 shows an upward trend in TDS throughout a month because of the addition of aluminum sulphate to the water sample every four days between January 20 to February 20, 2023.
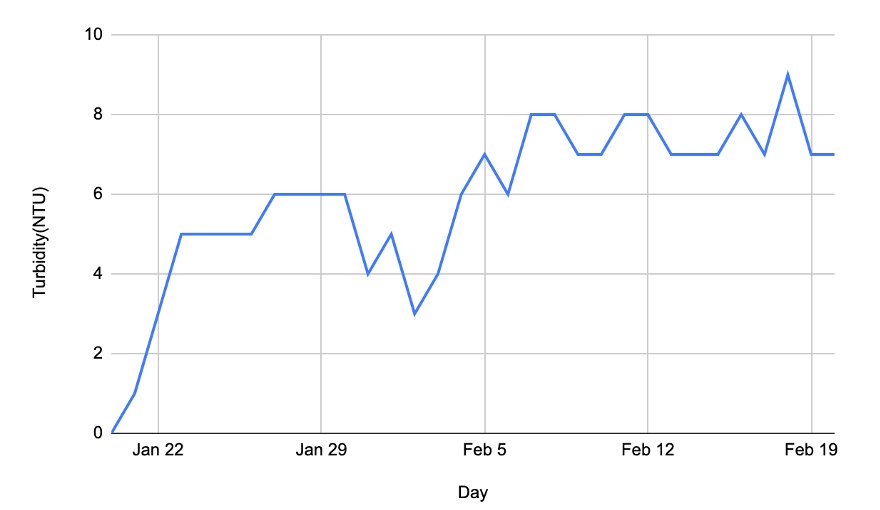
Figure 4: Turbidity was quantified in NTU throughout the data-gathering period of turbidity sensor readings connected to Arduino when placed in the water sample. Figure 3 shows an upward trend in turbidity throughout a month because of the addition of aluminum sulphate to the water sample every four days from January 20, 2023, to February 20, 2023.

Figure 5: Soil hydration in percentage was measured with a soil hydration sensor connected to Arduino throughout the data-gathering period. The reading shows little change as 14 percent is calibrated to the sensor's reading outside water at twenty-five degrees Celsius.

Figure 6: The second regression model training session involved 1000 epochs, MSE as the loss function, and the utilization of SGD to optimize the model and a learning rate of 0.0001. These changes decreased the loss of the network, especially near the end of the training session.

Figure 7: Third regression model training session with 4000 epochs, MSE as the loss function and the utilization of SGD to optimize the model and a learning rate of 0.0001). The increased training cycles did not aid in reducing the validation loss.

Figure 8: Fourth regression model training session with mean absolute error, SGD as the optimizer, and a learning rate of 0.0001. These changes reduced loss and validation loss.

Figure 9: Fifth regression model training session with mean absolute error, SGD as the optimizer, and a learning rate of 0.005. These changes consistently reduced the loss and validation loss.
DISCUSSION
This lab aimed to explore the creation of a device that can predict and track the pH, turbidity, TDS, and soil hydration of a water and soil sample. The findings of this lab demonstrate that the device successfully functions. It accurately tracked and predicted pH, soil hydration, turbidity, and TDS levels. Though the TDS measurement is slightly inaccurate due to a lack of a temperature sensor, the change in TDS can be comprehended as there is a known TDS reading of 30 ppm from the sensor. The neural network can become even more accurate with a greater data gathering period. Because of the minuscule dataset, the validation loss varied consistently throughout epochs. It is important to note that the model was fairly inconsistent regarding predictions. Also, the validation loss was relatively high relative to the validation loss of convolutional neural networks because the network tried to determine continuous numerical data instead of probabilities whose values lie from 0 to 1. The total loss of the network was 5.18, and the total validation loss was 25.69. As expected, the loss was less than the validation loss. Though the validation loss was 25.69, the model accurately predicted the pH, turbidity, TDS, and soil hydration in 8 days from when it was trained. It predicted the soil hydration correctly and the turbidity correctly. It predicted the pH to be just 0.05 points from where it was. It also predicted the TDS to be just 20 points from where it was. One gram of aluminum sulphate was added to the 250ml water sample every four days to stimulate change artificially. In doing so, the model was challenged to adapt. The model successfully adapted to this continuous change and predicted very accurate values. Figures 5-9 display multiple attempts to train the model. This resulted in lowering both the validation loss and the training loss (see Figure 9). Multiple machine learning models can already predict droughts and water pollution. However, the device has multiple advantages over these models.
The device can also identify areas that suffer from the effects of acid rain. The device may detect higher readings of pH after rain falls. Aluminum can leach from the soil as a result of acid rain falling (U. S. Geological Survey, n.d.). This aluminum may harm animals and trees (U. S. Geological Survey, n.d.). In addition, acid rain removes nutrients and minerals from the soil that trees require to grow (U. S. Geological Survey, n.d.). By tracking which areas are affected by acid rain and the future pH levels of areas affected by acid rain, the impacts of acid rain could be reduced by allowing certain groups to allocate resources to the areas that need to be relieved the most. With the device, areas subject to drought in the future could be identified and supplied with sufficient water resources beforehand. Chromium-6(Cr-6) is a carcinogen found in water in the United States (Jianyun1, C. et al., 2017). Cr-6 also has a pH range of about 1-3 in water. If an area already has a history of having high levels of Cr-6, this device may be used to determine if decreasing the levels of Cr-6 works. Of course, further research on areas with pH levels greater than a neutral pH would need to be conducted. An improvement that can be made to this device is the implementation of the process of pushing data stored on the device to an external, open-sourced, cloud-based database. This could allow various parties to access information about specific data about a region's water pollution and soil moisture, which could lead to relieving certain regions of water pollution faster. More accurate instruments could provide more accurate results. Moreover, an LCD panel with a higher resolution could improve the user interface. Instead of determining individual metrics of water, the device could compose a holistic metric of WQI (water quality index).
CONCLUSION
This project aimed to explore the creation of a device that can accurately forecast future soil hydration levels as well as the pH, turbidity, and TDS of water. A device that can accurately predict such factors has been successfully developed. An advantage of this device over contemporary machine learning algorithms is the ability to continuously track relevant data in a particular region, allowing for prompt intervention if water quality changes. Compared to conventional techniques that entail manual sampling and laboratory testing, it is also more efficient in terms of time, labour, and cost. The device's portability and ease of use are advantages over modern machine learning algorithms running on computers. This makes the device suitable for fieldwork in remote areas. This device has multiple applications. Further improvements to this device could include the addition of more sensors to track more factors that influence the health of water and soil, pushing data to the cloud, where it can easily be accessible by other parties, as well as automation of data gathering to minimize human involvement.
REFERENCES
[1] Drought. (n.d.). Retrieved March 10, 2023, from https://www.who.int/health-topics/drought
[2] Water scarcity | UNICEF. (n.d.). Retrieved July 11, 2023, from https://www.unicef.org/wash/water-scarcity
[3] CDC. (2022, May 31). Global wash fast facts. Centers for Disease Control and Prevention. https://www.cdc.gov/healthywater/global/wash_statistics.html
[4] Zhu, M., Wang, J., Yang, X., Zhang, Y., Zhang, L., Ren, H., ... & Ye, L. (2022). A review of the application of machine learning in water quality evaluation. Eco-Environment & Health."
[5] Ks0429 keyestudio tds meter v1. 0—Keyestudio wiki. (n.d.). Retrieved February 19, 2023, from https://wiki.keyestudio.com/KS0429_keyestudio_TDS_Meter_V1.0
[6] How does a ph probe work? (2021, October 18). Atlas Scientific. https://atlas-scientific.com/blog/how-does-a-ph-probe-work/
[7] Admin. (2022, August 22). TDS sensor & Arduino interfacing for water quality monitoring. How To Electronics. https://how2electronics.com/tds-sensor-arduino-interfacing-water-quality-monitoring/
[8] Interface Capacitive Soil moisture sensor v1.2 with Arduino, LCD and OLED. (n.d.). Circuit Schools. Retrieved February 23, 2023, from https://www.circuitschools.com/interface-capacitive-soil-moisture-sensor-v1-2-with-arduino-lcd-and-oled/
[9] US EPA, O. (2015, November 4). Ph [Data and Tools]. https://www.epa.gov/caddis-vol2/ph
[10] Canada, H. (2014, February 5). Government of Canada. Canada.ca. https://www.canada.ca/en/health-canada/services/publications/healthy-living/guidelines-canadian-drinking-water-quality-turbidity/page-4-guidelines-canadian-drinking-water-quality-turbidity.html
[11] What is TDS in water & why should you measure it? (n.d.). Fresh Water Systems. Retrieved July 11, 2023, from https://www.freshwatersystems.com/blogs/blog/what-is-tds-in-water-why-should-you-measure-it
[12] Acid rain and water | U. S. Geological survey. (n.d.). Retrieved February 25, 2023, from https://www.usgs.gov/special-topics/water-science-school/science/acid-rain-and-water#:~:text=Acid%20rain%20leaches%20aluminum%20from,that%20trees%20need%20to%20grow.
[13] Jianyun1, C., Yunfan1, S., & Chunyan1, L. (2017, December 1). IOPscience. IOP Conference Series: Earth and Environmental Science. https://iopscience.iop.org/article/10.1088/1755-1315/104/1/012015
[14] IARC Working Group on the Evaluation of Carcinogenic Risks to Humans, World Health Organization, & International Agency for Research on Cancer. (2004). Some drinking-water disinfectants and contaminants, including arsenic (Vol. 84). IARC
[15] Water turbidity sensors & testing equipment—Aquaread. (n.d.). Retrieved February 23, 2023, from https://www.aquaread.com/sensors/turbidity
[16] Katsoyiannis, I. A., & Katsoyiannis, A. A. (2006). Arsenic and other metal contamination of groundwaters in the industrial area of Thessaloniki, Northern Greece. Environmental Monitoring and Assessment, 123, 393-406.
This link actually takes you to a website of a journal, not the actual paper. Try finding a link to the paper directly and put that here instead.
about the author
Anish Rathod is a high school student from Burlington, Ontario. He is currently enrolled in the IB Diploma Programme. He has been acknowledged at the Bay Area Science and Engineering Fair and in a local newspaper for his work on a device that predicts water pollution and drought. He is currently a coding teacher. In addition to this, Anish has developed multiple individual machine-learning projects including a Yelp rating reviewer, a YOLO model for image detection, and a cancer cell classifier. He has also been working on a project that integrates machine learning to classify water pollution.