ALIA WAHBAN
she/her | age 15
Archelor Mittal Global R&D Hamilton Award for Technology Application, Canadian Nuclear Society (Golden Horseshoe Branch) Award (Intermediate or Senior), Dillion Consulting Science and Engineering Award, Gold Merit Award, and Canada-Wide Science Fair Trip Award; Bay Area Science and Engineering Fair | Centre for Canadian Nuclear Sustainability Award Sponsor: Centre for Canadian Nuclear Sustainability Award, Canada-Wide Science Fair
Edited by Pranav Khanolkar
INTRODUCTION
Background
The Paris Agreement, which the United Nations adopted, sets out a global framework to limit climate change (UNFCCC, 2023). The agreement and many other Environmental Social & Governance (ESG) initiatives lead to an increased focus on achieving net-zero carbon footprint (Natural Resources Canada, 2020).
Hydrogen is one of the most important gases that can potentially replace natural gas. It is considered an ideal candidate by electric power producers for power generation applications. This idea has already been expressed as part of a net-zero carbon grid by 2050 in many countries, including Canada. More ambitious goals for a net-zero carbon economy envision eliminating all types of fossil fuels and replacing them with clean alternative fuels such as hydrogen.
Emissions from fossil fuels such as nitrogen oxides (NOx), hydrocarbons (HC), carbon dioxide (CO2) and particulate matter (PM) are major sources of pollution. Hydrogen-fueled power plants emit none of these harmful substances, only water and warm air. Thus, many believe that hydrogen is the most likely path towards achieving the net-zero goal set by the Paris Agreement.
Both the USA’s Energy Policy Act of 1992 and the Canadian Ministry of Natural Resources recognize hydrogen as a fuel that can replace traditional fossil fuels (U.S. Energy Information Administration, n. d.; Natural Resources Canada, 2020).
Figure 1. The average CO2 produced in each province/territory (Natural Resources Canada, 2020)
The Canadian Ministry of Natural Resources has laid out plans around hydrogen fuel as a tool to achieve the goal of net-zero emissions by 2050. The Ministry developed and published 141 pages around hydrogen strategy in December 2020 (Government of Ontario, 2022)
According to the Ministry of Natural Resources, Canada, 17% of Canada’s grid power is produced from fossil fuel combustion, which could be eventually displaced with hydrogen, significantly reducing our carbon footprint. The study broke down emissions emitted in Figure 1 by province. For example, Ontario emits 40g CO2 for every kWh produced while Canada averages 140 g/kWh (Natural Resources Canada, 2020).
Questions
If it is proven that hydrogen can replace fossil fuel and achieve zero emissions, why is the hydrogen industry still nascent given the increased interest in greenhouse gas reduction?
Hypothesis
Hydrogen is the most likely path toward achieving the net-zero emissions goal set by the Paris Agreement and can play a major role as an energy carrier in power generation.
It is possible to calculate potential CO2 reduction in Ontario when substituting natural gas with green hydrogen in power generation applications.
METHODOLOGY
Quantify Potential CO2 Reduction in Ontario Power Plants
Data Collection
To quantify the potential reduction in CO2, data for all gas fired power plants in Ontario was obtained from the Ontario Power Generation (OPG) and Independent Electricity System Operator (IESO) websites and compiled into Table 1, showing that Ontario has a total capacity of 7,760 MW of natural gas fired power plants (OPG, n.d.; Independent Electricity System Operator, n.d.).
Data Validation
The information sourced in Table 1 was cross-referenced with data obtained from the Canada Energy Regulator website (Figure 2) showing that Ontario produced a total of 153,000 GWh in 2019 (Canada Energy Regulator, 2022). 7% of that is derived from burning natural gas.
Figure 2. Electricity Generation by Fuel Type (Canada Energy Regulator, 2022)
Table 1. Gas Power Plants in Ontario (OPG, n.d.; Independent Electricity System Operator, n.d.)
CO2 emission Calculations
Annual power produced in Ontario from burning natural gas was found to equal 10,710 GWh (Figure 2) (Government of Ontario, 2022). As displayed in Table 2, the data on the total annual net CO2 emitted shows that 0.44 kg CO2 is emitted for every kWh produced from burning natural gas. Thus, CO2 emitted equals 10,710,000,000 kWh x 0.44 kg = 4,712,400 tonnes/year of CO2. For the purpose of this study, CO2 emitted daily was tracked in this project (4,712,4000 / 365 = 12,910 tonnes daily).
Table 2. Amount of CO2 emitted by fuel type (U.S. Energy Information Administration, n. d.)
Analyzed Data
The project utilized data published by the U.S Energy Information Administration (Table 2) to estimate the CO2 emitted per kWh produced from burning natural gas. The numbers in Table 2 match its Canadian counterpart since the technology used for power generation and the fuel characteristics are comparable (Government of Ontario, 2022). While Ontario has a total capacity of 7,760 MW with natural gas power plants, according to IESO, natural gas represents nearly 30% of Ontario's total generating capacity (Independent Electric System Operator, n.d.). Still, it accounts for only 10% of the total annual power generation production in Ontario, which is roughly 150,000 GWh. The variation in power production from natural gas depends on the power demand and the availability of other power sources. From OPG and IESO web sites, it was concluded that Ontario produces 1,500 to 2,000 MWh on average from the listed gas plants (OPG, n.d.; Independent Electricity System Operator, n.d.).
Understanding the Relationship
As mentioned earlier, hydrogen has one third of the energy content of natural gas by volume. When blending 21% hydrogen with 79% Natural Gas by volume only about 7% CO2 reduction would be achieved. The volumetric mixing ratio deviates from the CO2 reduction due to the energy share of hydrogen compared to Natural Gas (Table 3). The energy content of the hydrogen versus natural gas drives this nonlinear curve. For example, attaining 50% CO2 reduction will require a blend of 75% hydrogen and 25% natural gas by volume.
Figure 3. Relationship between CO2 reduction and NG/ H2 blending %
Table 3. Volume and Energy share of H2
Blending concentrations with correlating CO2 reduction
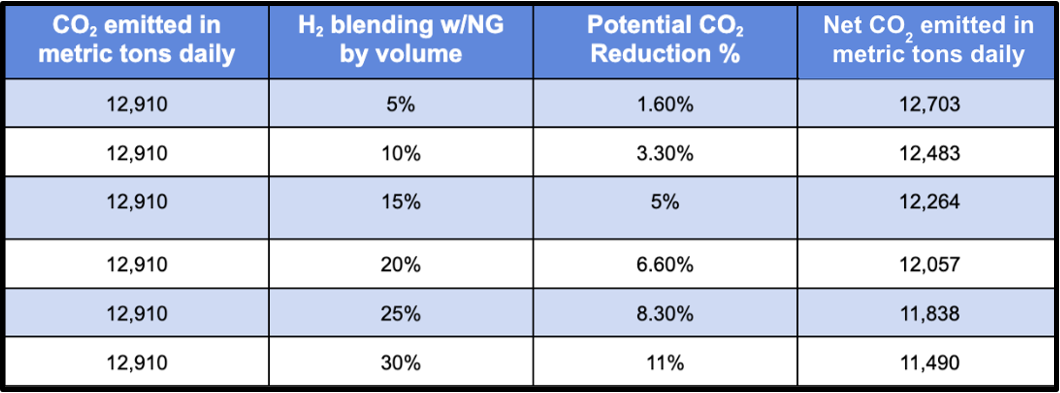
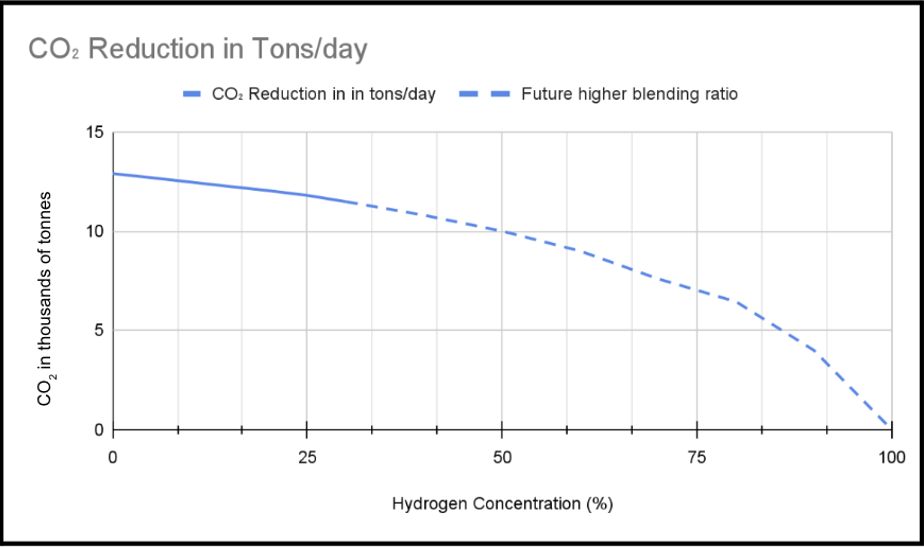
For this study, CO2 emitted on a daily basis was tracked. From the calculation section, 12,910 tonnes/day is being emitted. Based on the methodology outlined in the previous steps, Table 4 and Figure 4 were created to reflect potential CO2 reduction in Ontario when blending hydrogen with natural gas in the existing pipeline network. The dotted line represents the expected CO2 reduction at higher blending ratios beyond the 25% threshold. As noted in Table 4, with 25% blending ratio, Ontario could reduce CO2 emitted by 1,072 tonnes/day.
Table 4. Potential CO2 Reduction in Ontario when blending H2 with NG
Figure 4. Potential CO2 Reduction when blending H2 with NG
RESULTS
This project reviewed a technical report by NREL, Sandia National Laboratories, and Pacific Northwest National Laboratory on hydrogen technology, titled “Hydrogen Blending into Natural Gas Pipeline. Infrastructure: Review of the State of Technology” (Topolski et al., 2022). The report examined material, economic, and operational factors and mathematical models demonstrating how hydrogen blending affects natural gas infrastructure (Topolski et al., 2022).
The results from these studies and papers suggested that the status quo does not allow for the adoption of pure hydrogen before addressing several challenges considered in this project. In the meantime, a blend of 25% hydrogen and 75% natural gas by volume is an existing technology today, and it is proven to drive lower carbon emissions.
Challenges:
Hydrogen Safety - wide flammability range of 4%-75%
Hydrogen cost is higher than natural gas
Complicated storage techniques
Steel embrittlement
Table 5. Energy content Comparison between NG and H2 (Topolski et al., 2022)
DISCUSSION
Analyzed Data
Blending hydrogen with natural gas for power generation is a promising approach to reducing CO2 (Hydrogen and Fuel Cell Technologies Office, 2022). It was shown in Table 4 that a blend of 25% hydrogen and 75% natural gas could reduce the CO2 emission in Ontario from 12,910 tonnes/day to 11,838, a reduction of 1,072 tonnes daily.
Higher blending ratios are achievable through careful evaluation for safety, existing combustion equipment (Gas turbines), and the gas pipeline infrastructure (Hydrogen and Fuel Cell Technologies Office, 2022).
Technical Feasibility
Hydrogen has been used in fuel cells to produce electricity and is recognized by the Canadian Ministry of Natural Resources as an alternative fuel (Natural Resources Canada, 2020). In addition, the technology for hydrogen-burning gas turbines is already available today. Several gas turbine manufacturers such as General Electric and Mitsubishi issued statements and papers indicating that existing natural gas turbines can either run on a blended mixtures of hydrogen and natural gas or use pure hydrogen to emit zero emissions (General Electric, n.d.; Mitsubishi Power, 2022)
The conclusions from those studies and papers suggested that the status quo does not allow for the imminent use of pure hydrogen before addressing several challenges discussed later in this project. Until solutions are found for all challenges, gas turbine manufacturers confirmed our ability to blend hydrogen with natural gas up to 25% by volume to decarbonize our province (Topolski et al., 2022).
CONCLUSION
This project demonstrated that blending hydrogen with natural gas is a valid method to reduce carbon emissions (Enbridge, n.d.).
Excess energy generated from renewable resources due to fluctuations in supply and demand can be utilized to produce green hydrogen through the electrolysis process. This green hydrogen can then be used as an energy carrier for electricity production.
The 25% mix of hydrogen and natural gas by volume represents an immediate solution for greenhouse gas emission reduction. This specific blending ratio could lead to the reduction of 1,072 tonnes of CO2 per day in Ontario.
Achieving net-zero emission requires addressing the challenges of hydrogen, including cost, storage, steel embrittlement, and safety, while increasing the blending ratio with natural gas.
Research findings indicate a need to develop new methods to detect hydrogen leaks as the hydrogen-based industry grows. To promote the extensive usage of gasochromic technology, it is necessary to carry out additional validation and testing to guarantee its reliability.
REFERENCES
Canada Energy Regulator (2022). Provincial and Territorial Energy Profiles – Ontario. Retrieved from https://www.cer-rec.gc.ca/en/data-analysis/energy-markets/provincial-territorial-energy-profiles/provincial-territorial-energy-profiles-ontario.html#:~:text=In%202019%2C%20about%2092%25%20of
Enbridge. (n.d.) Hydrogen. https://www.enbridgegas.com/sustainability/clean-heating/hydrogen
General Electric. (n.d.). Hydrogen for Power Generation: Experience, requirements, and implications for use in gas turbines. https://www.ge.com/content/dam/gepower-new/global/en_US/downloads/gas-new-site/future-of-energy/hydrogen-for-power-gen-gea34805.pdf
Hydrogen and Fuel Cell Technologies Office (2022). HyBlend: Opportunities for Hydrogen Blending in Natural Gas Pipelines. Energy.gov, www.energy.gov/eere/fuelcells/hyblend-opportunities-hydrogen-blending-natural-gas-pipelines.
IESO (n.d.). Independent Electricity System Operator. https://www.ieso.ca/en/Learn/Ontario-Electricity-Grid/Supply-Mix-and-Generation/. Accessed 22 Apr. 2023.
Mitsubishi Power. (2022). Mitsubishi Power Completes Largest Hydrogen Fuel Blending Project, https://power.mhi.com/regions/mena/news/mitsubishi-power-18#:~:text=Mitsubishi%20Power%20completed%20the%20hydrogen,national%20research%20and%20development%20agency. Accessed 22 Apr. 2023.
Natural Resources Canada (2020). HYDROGEN STRATEGY FOR CANADA Seizing the Opportunities for Hydrogen: A Call to Action. https://natural-resources.canada.ca/sites/nrcan/files/environment/hydrogen/NRCan_Hydrogen-Strategy-Canada-na-en-v3.pdf
Government of Ontario (2022). Ontario’s Low-Carbon Hydrogen Strategy, www.ontario.ca/page/ontarios-low-carbon-hydrogen-strategy.
OPG. (2021). Powering Ontario > Gas Power , www.opg.com/powering-ontario/our-generation/gas-power/.
Topolski, K., Reznicek, E., Erdener, B., San Marchi, C., Ronevich, J., Fring, L., Simmons, K., Guerra Fernandez, O., Hodge, B.-M., & Chung, M. (2022). Hydrogen Blending into Natural Gas Pipeline Infrastructure: Review of the State of Technology. https://www.nrel.gov/docs/fy23osti/81704.pdf
UNFCCC. (2023). The Paris Agreement. United Nations Climate Change; United Nations. https://unfccc.int/process-and-meetings/the-paris-agreement
U.S. Energy Information Administration. (n. d.) House much carbon dioxide is produced per kilometer of U.S. electricity generation? U.S. Energy Information Administration (EIA). Www.eia.gov, www.eia.gov/tools/faqs/faq.php?id=74&t=11#:~:text=This%20. Accessed 22 Apr. 2023.
ABOUT THE AUTHOR
Alia Wahban
Hello! My name is Alia and I am currently in Grade 11 and passionate about environmental issues. I was inspired by my participation in Model United Nations (UN) to take action on climate change. Through my research, I discovered the potential of green hydrogen as a clean energy source, and how it could address the intermittency of renewable resources. This led me to embark on a project that explored the technical feasibility of replacing natural gas with green hydrogen for power generation in the local community of Ontario.
Aside from my love for research, I also enjoy reading, playing soccer and squash, as well as travelling.


